
ChartGo Guide : Step-by-Step Guides and Resource
Welcome to the ChartGo Guide Center! Here you'll find guides on how to create charts, use ChartGo's features, and navigate the platform effectively. Whether you're new or experienced, our step-by-step instructions are designed to help you create professional-looking charts easily. Perfect for understanding all our features and making the most of ChartGo.
HOW TO USE CHARTGO • QUICK STEP BY STEP GUIDE
Let's Begin
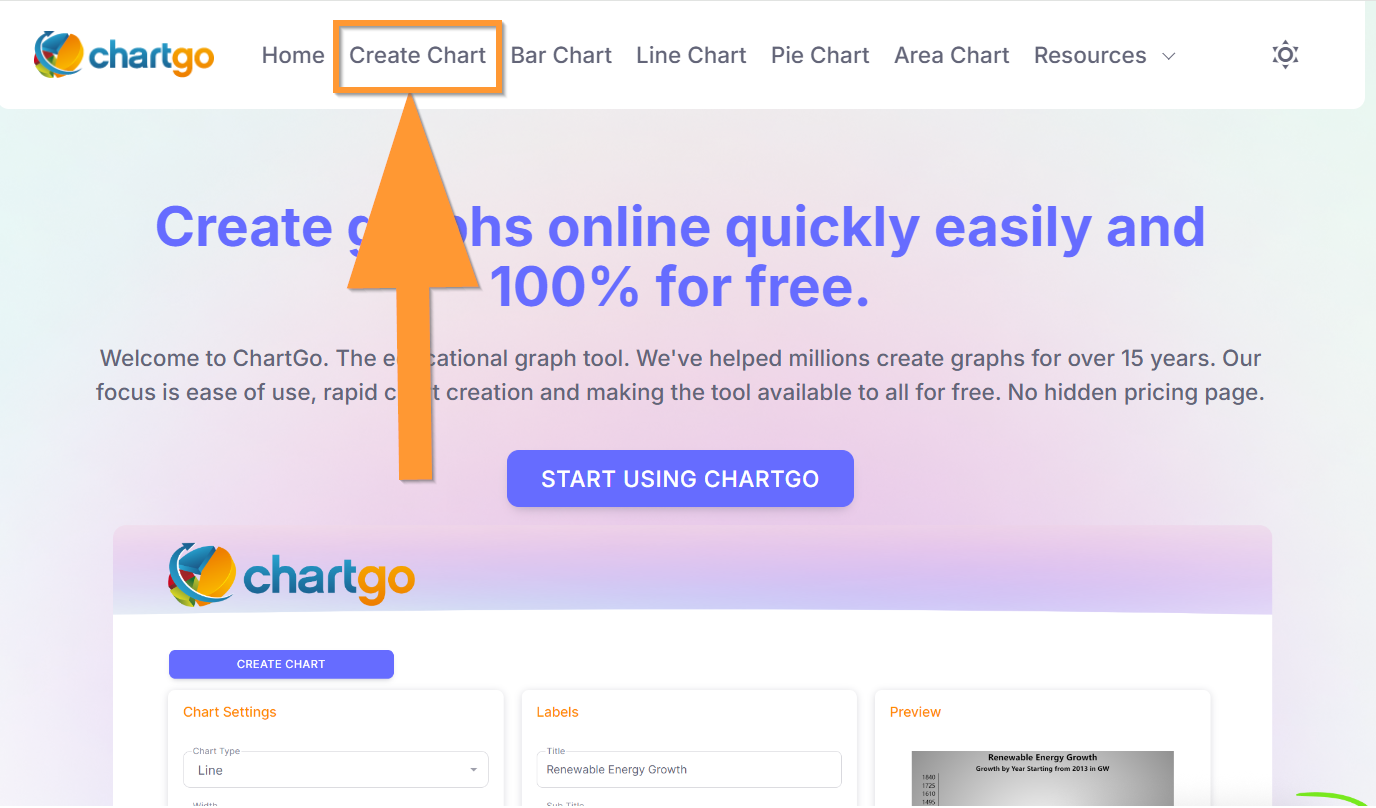
When you visit ChartGo, you will land on the home page. To start creating charts, click on the Create Chart link on the top menu.
You can also explore the home page further and find other useful pages like the Template section, Tutorials, The blog and This Guide page.
The Create Chart Page
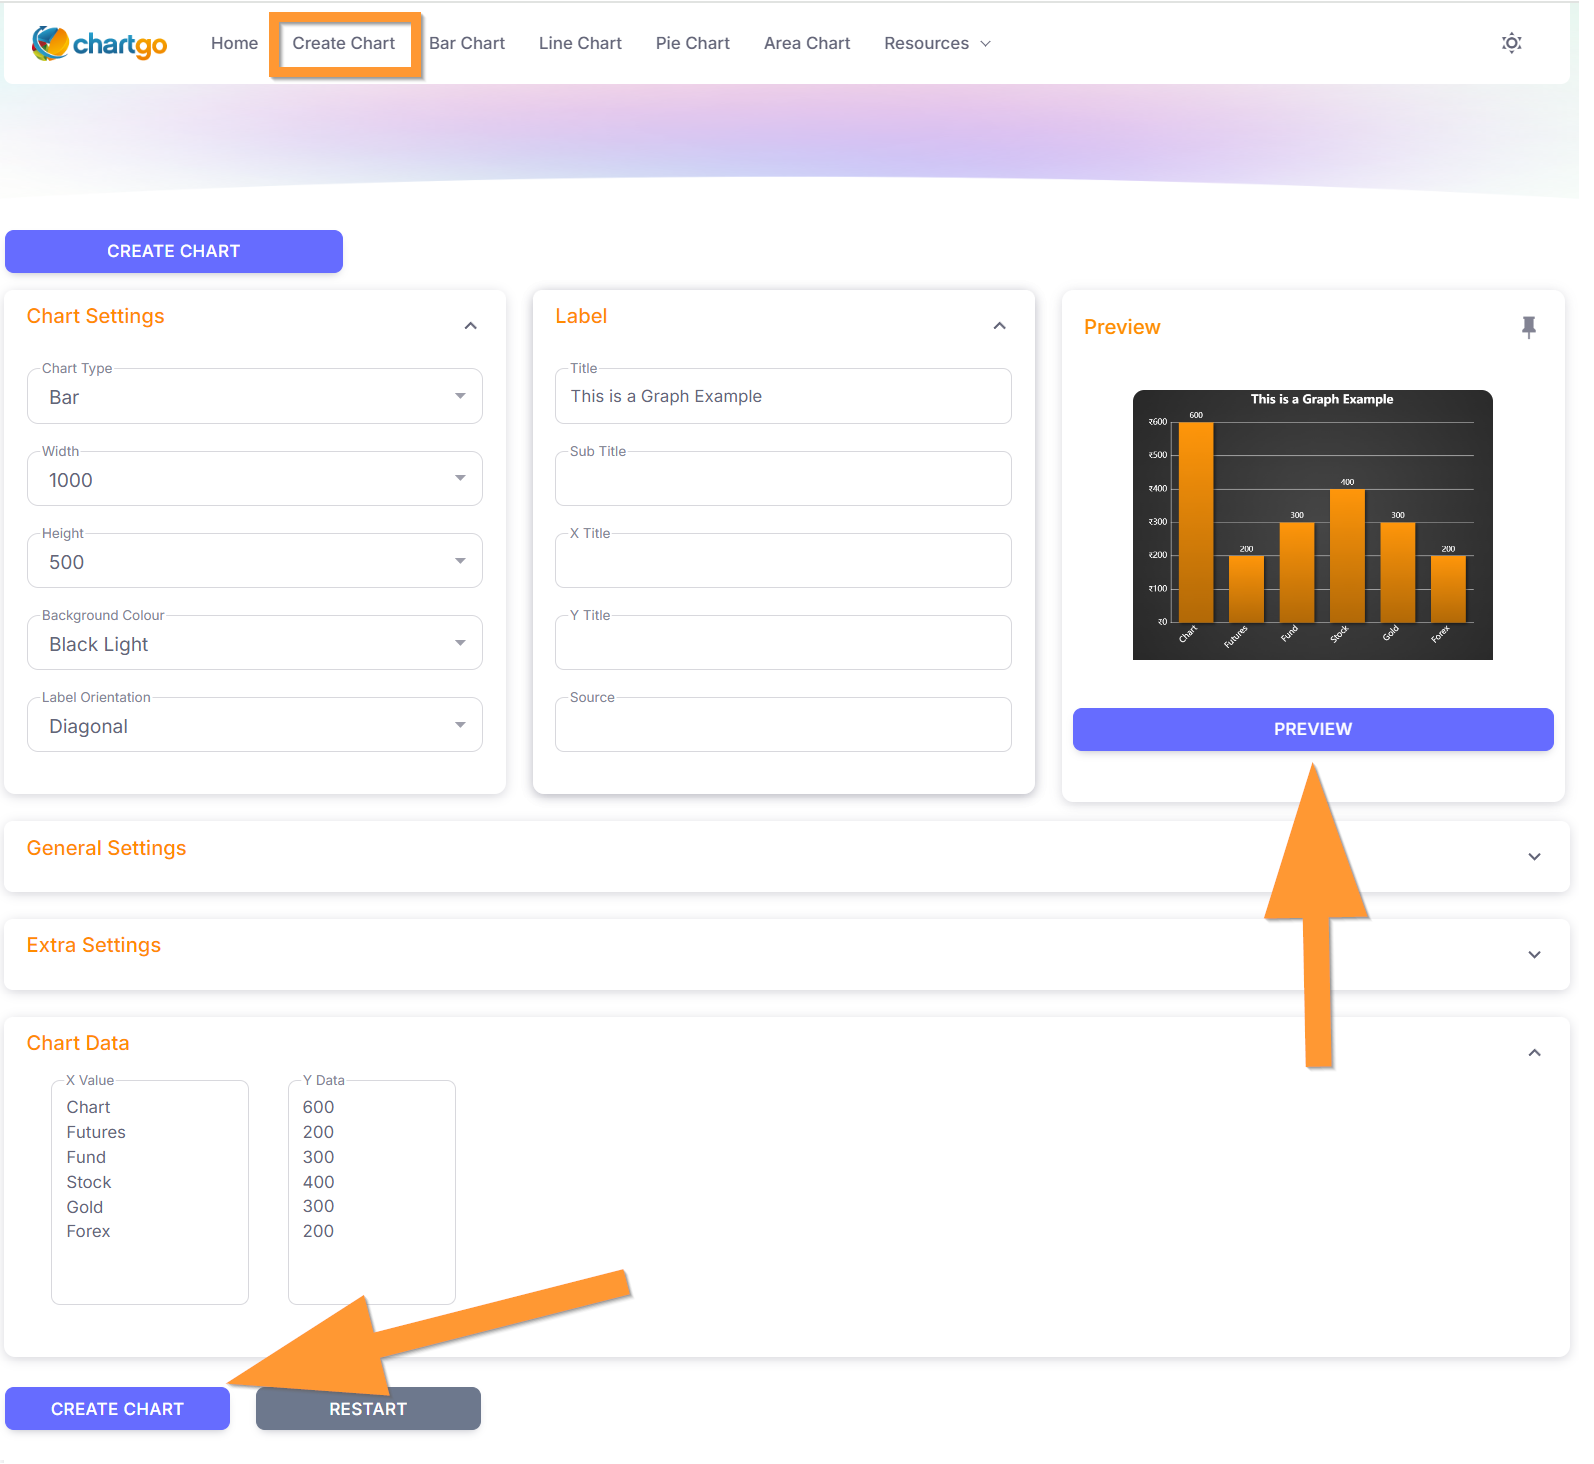
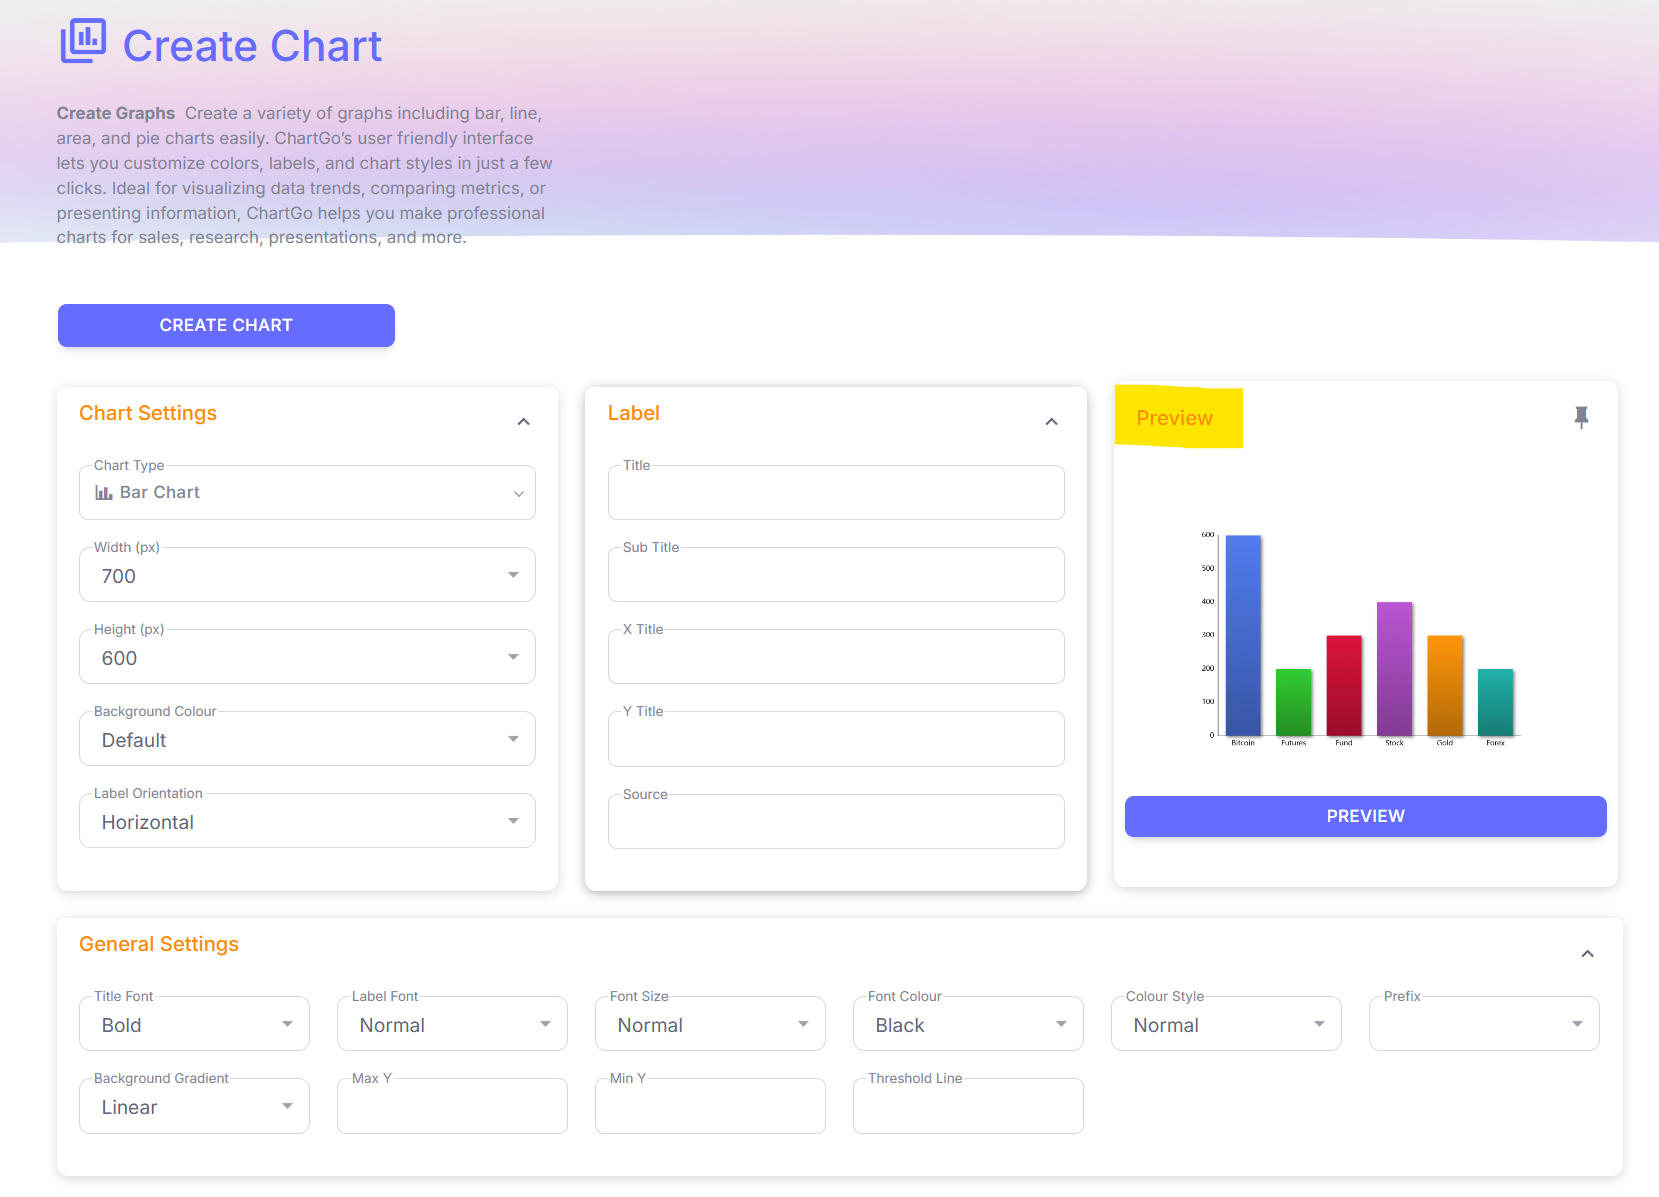
The create chart page is where you enter all the necessary information to generate your chart. The page consists of two important sections, various Settings sections and the Data section.
- The Settings sections contain fields and options that control the appearance of the of the graph. The visualization of your chart.
- The Data section is where you enter your data values that you want represented on your chart. The data represenation of your graph.
You will notice a Preview button and preview window on the page. This window allows your to preview your graph. When you're satisfied with your choices, press the Create Chart button to generate your chart. Your final chart will appear in the Result Page.
Result Page
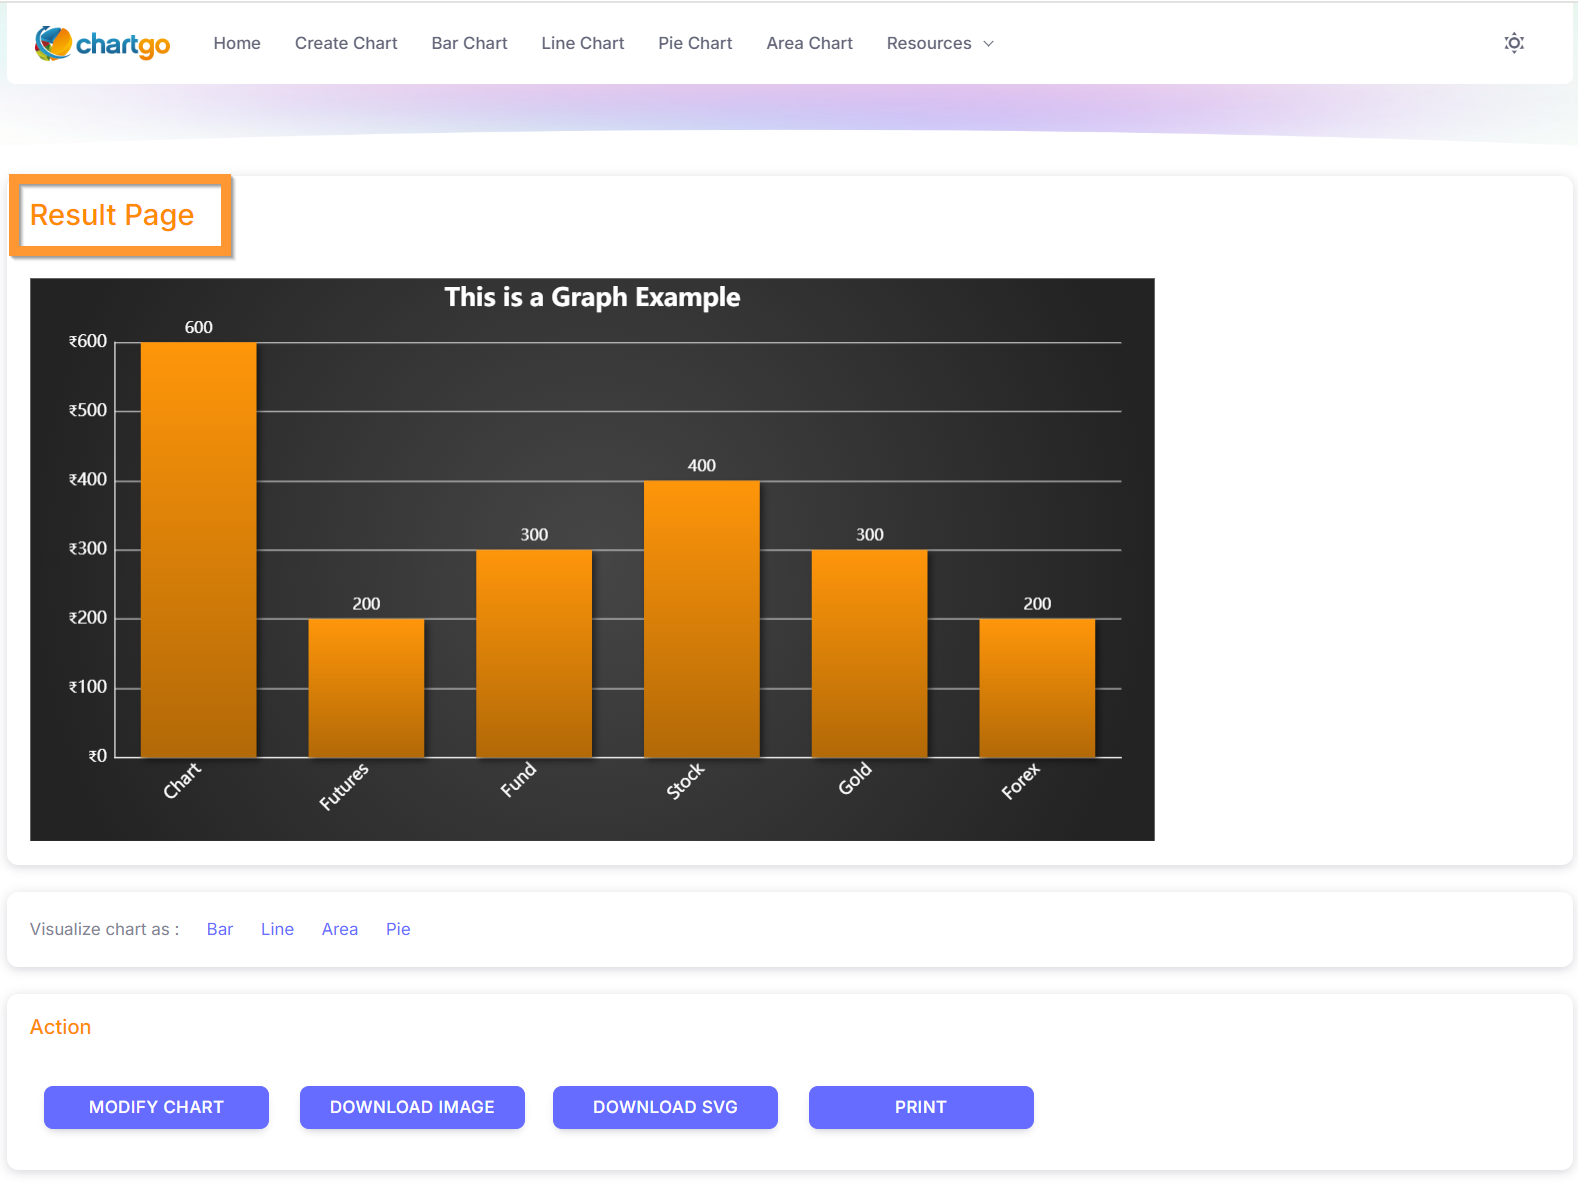
Your generated chart appears here in the result page. From here you have the option of making further changes to your chart by clicking on the modify button which will return you the Create Chart page.
Other options include downloading an image of your graph, displaying your data in a table format or displaying an printable version of your graph. You can continue learning more details in the next Guide or simply start Charting! We encourage exploring all the different options. Its the easiest way to learn. Enjoy.
UNDERSTANDING CHARTGO • DETAILED GUIDE
The Settings
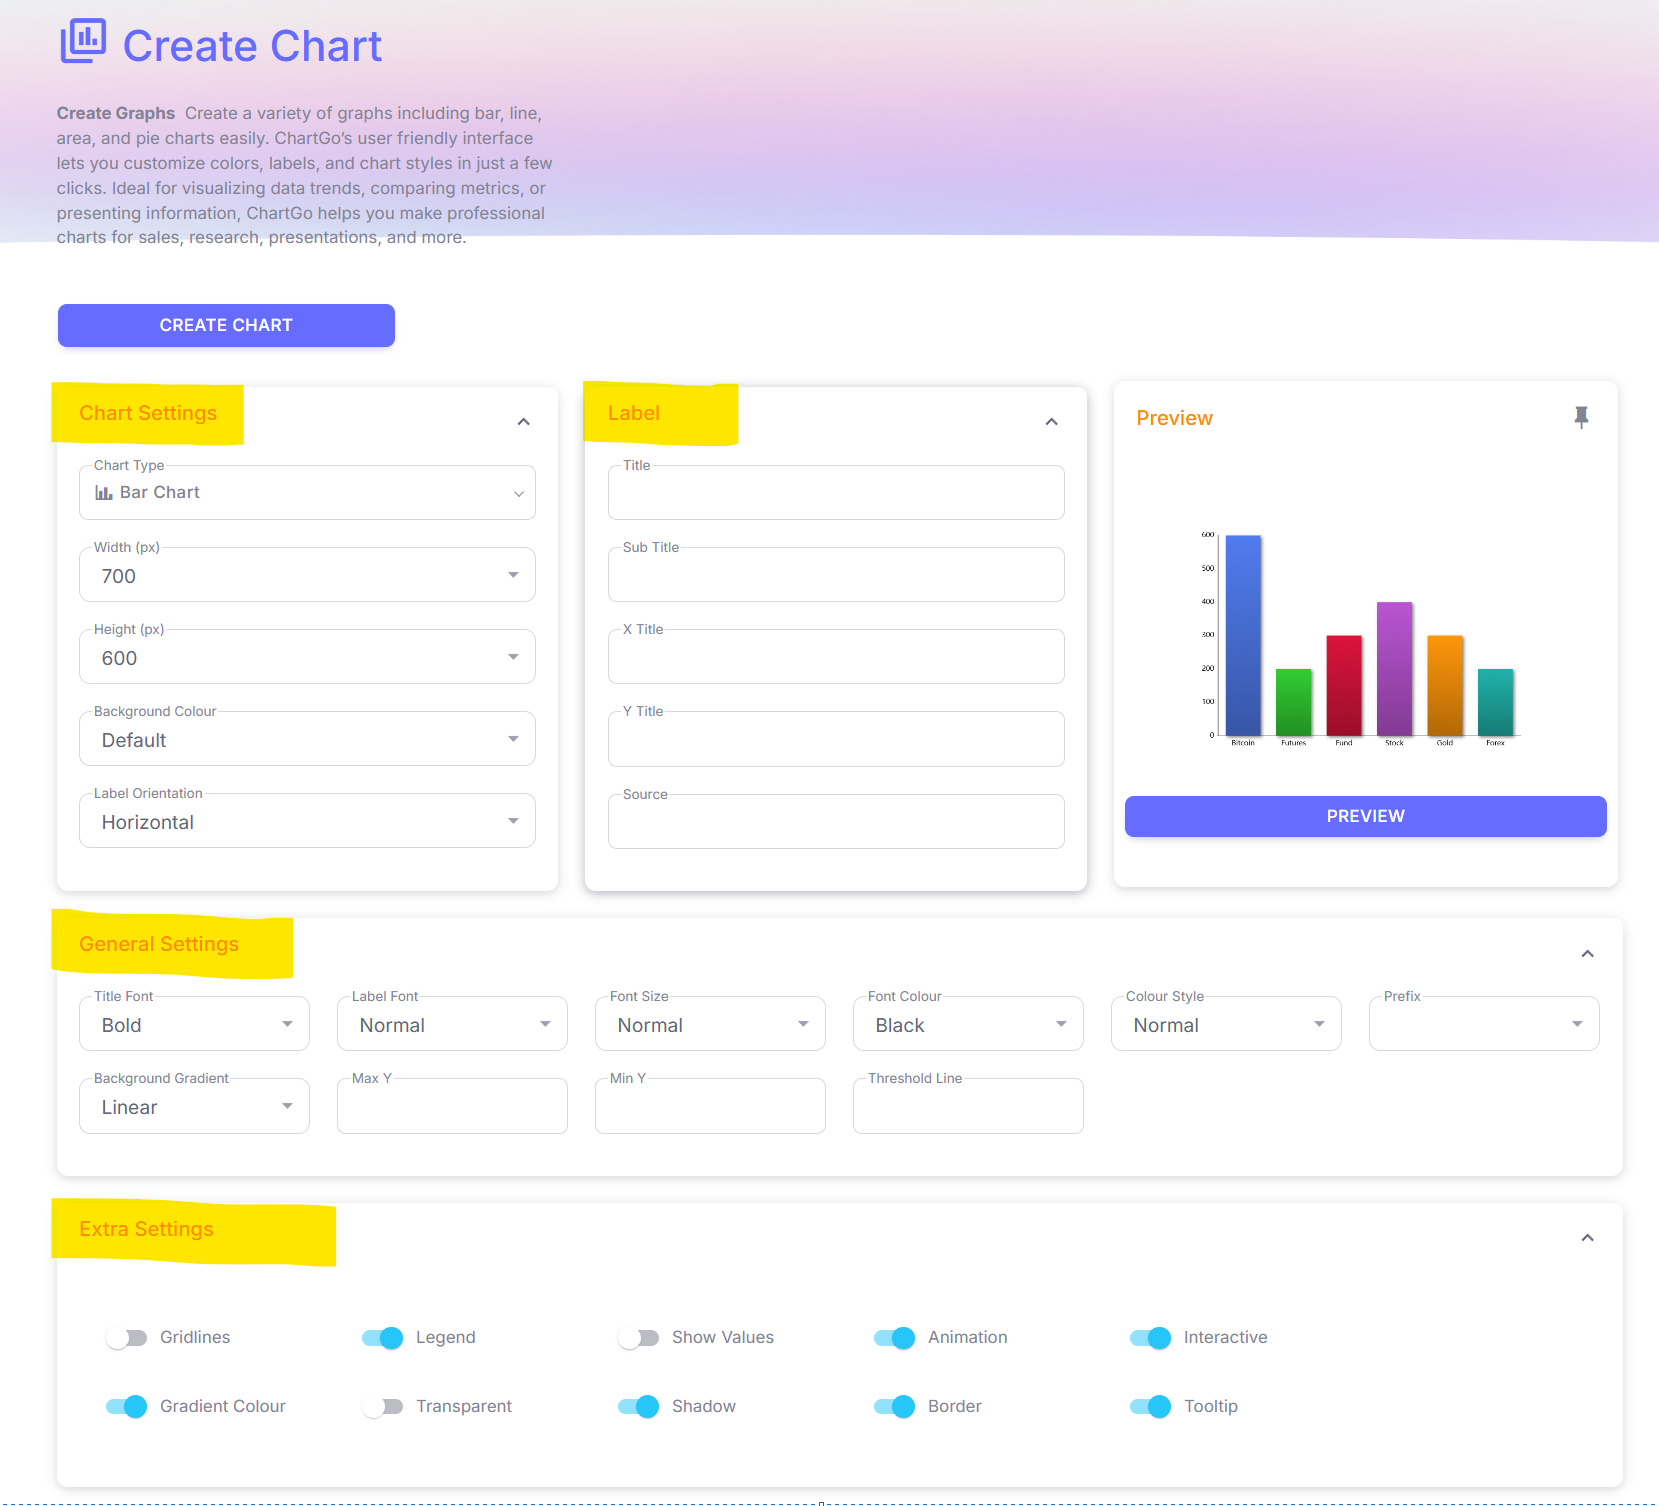
In the Create Chart Page, you will find various Settings Sections. The settings sections contain different types of options that control how your graph is visualized. The options can consist of drop-down lists, check boxes or input text fields. The important thing to remember is that each option changes the appearance of your chart. The different sections include
- The Chart Settings section lets you choose whether you your graph to be a pie cart, line, area or bar graph
- The Labels section which you use for titles and labels
- The General section gives you more appearance specific options
- The Extra settings gives you additional visualization options
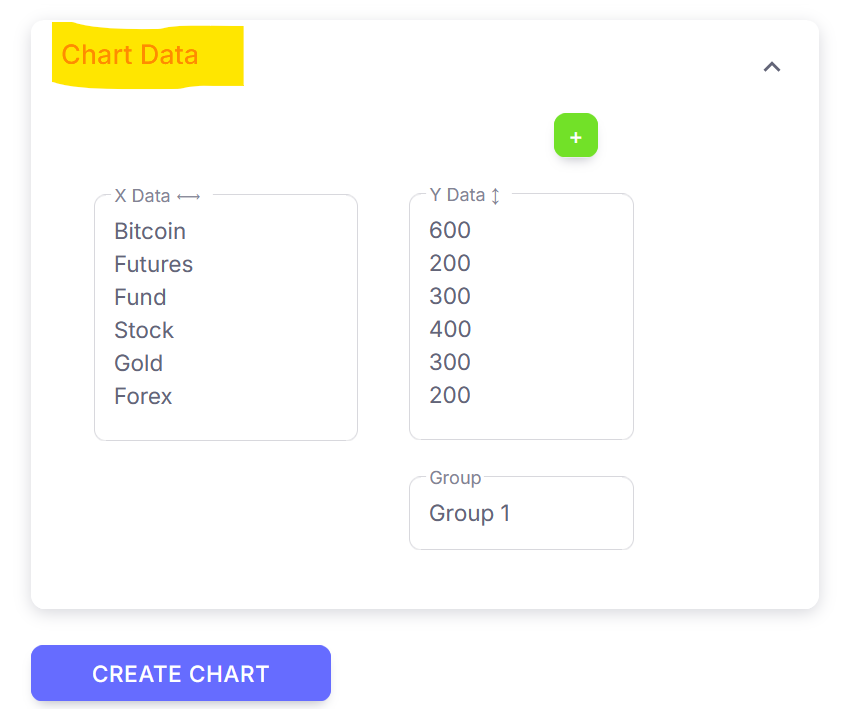
The Data
The data section is where you would enter all the data you want displayed on your graph. The data section consists of three important parts : The X data, The Y data and The Group name.
- The X data (Horizontal axis) is where you enter values such as students names, dates, cities, sports, fruits or any type of text information to label your data.
- The Y data (Vertical axis) is where you enter numeric values that will match up with the data entered in X. The Y data only accepts numbers.
- The Groupe field, also referred to as Series or Dataset or Category, is used when you have more than one Y data group. Use this field to differentiate each Y data group. To create more groups of Y data, click on the plus icon.
Preview
On the Create Chart Page, you will notice a Preview button and Preview Image. To use them, all you need to do is click on the Preview button at any time. The preview is helpful for :
- The X data (Horizontal axis) is where you enter values such as students names, dates, cities, sports, fruits or any type of text information to label your data.
- The Y data (Vertical axis) is where you enter numeric values that will match up with the data entered in X. The Y data only accepts numbers.
- The Groupe field, also referred to as Series or Dataset or Category, is the name you enter when you have more than one Y data group. Use this field to differentiate each Y data group. To create more groups of Y data, click on the plus icon.
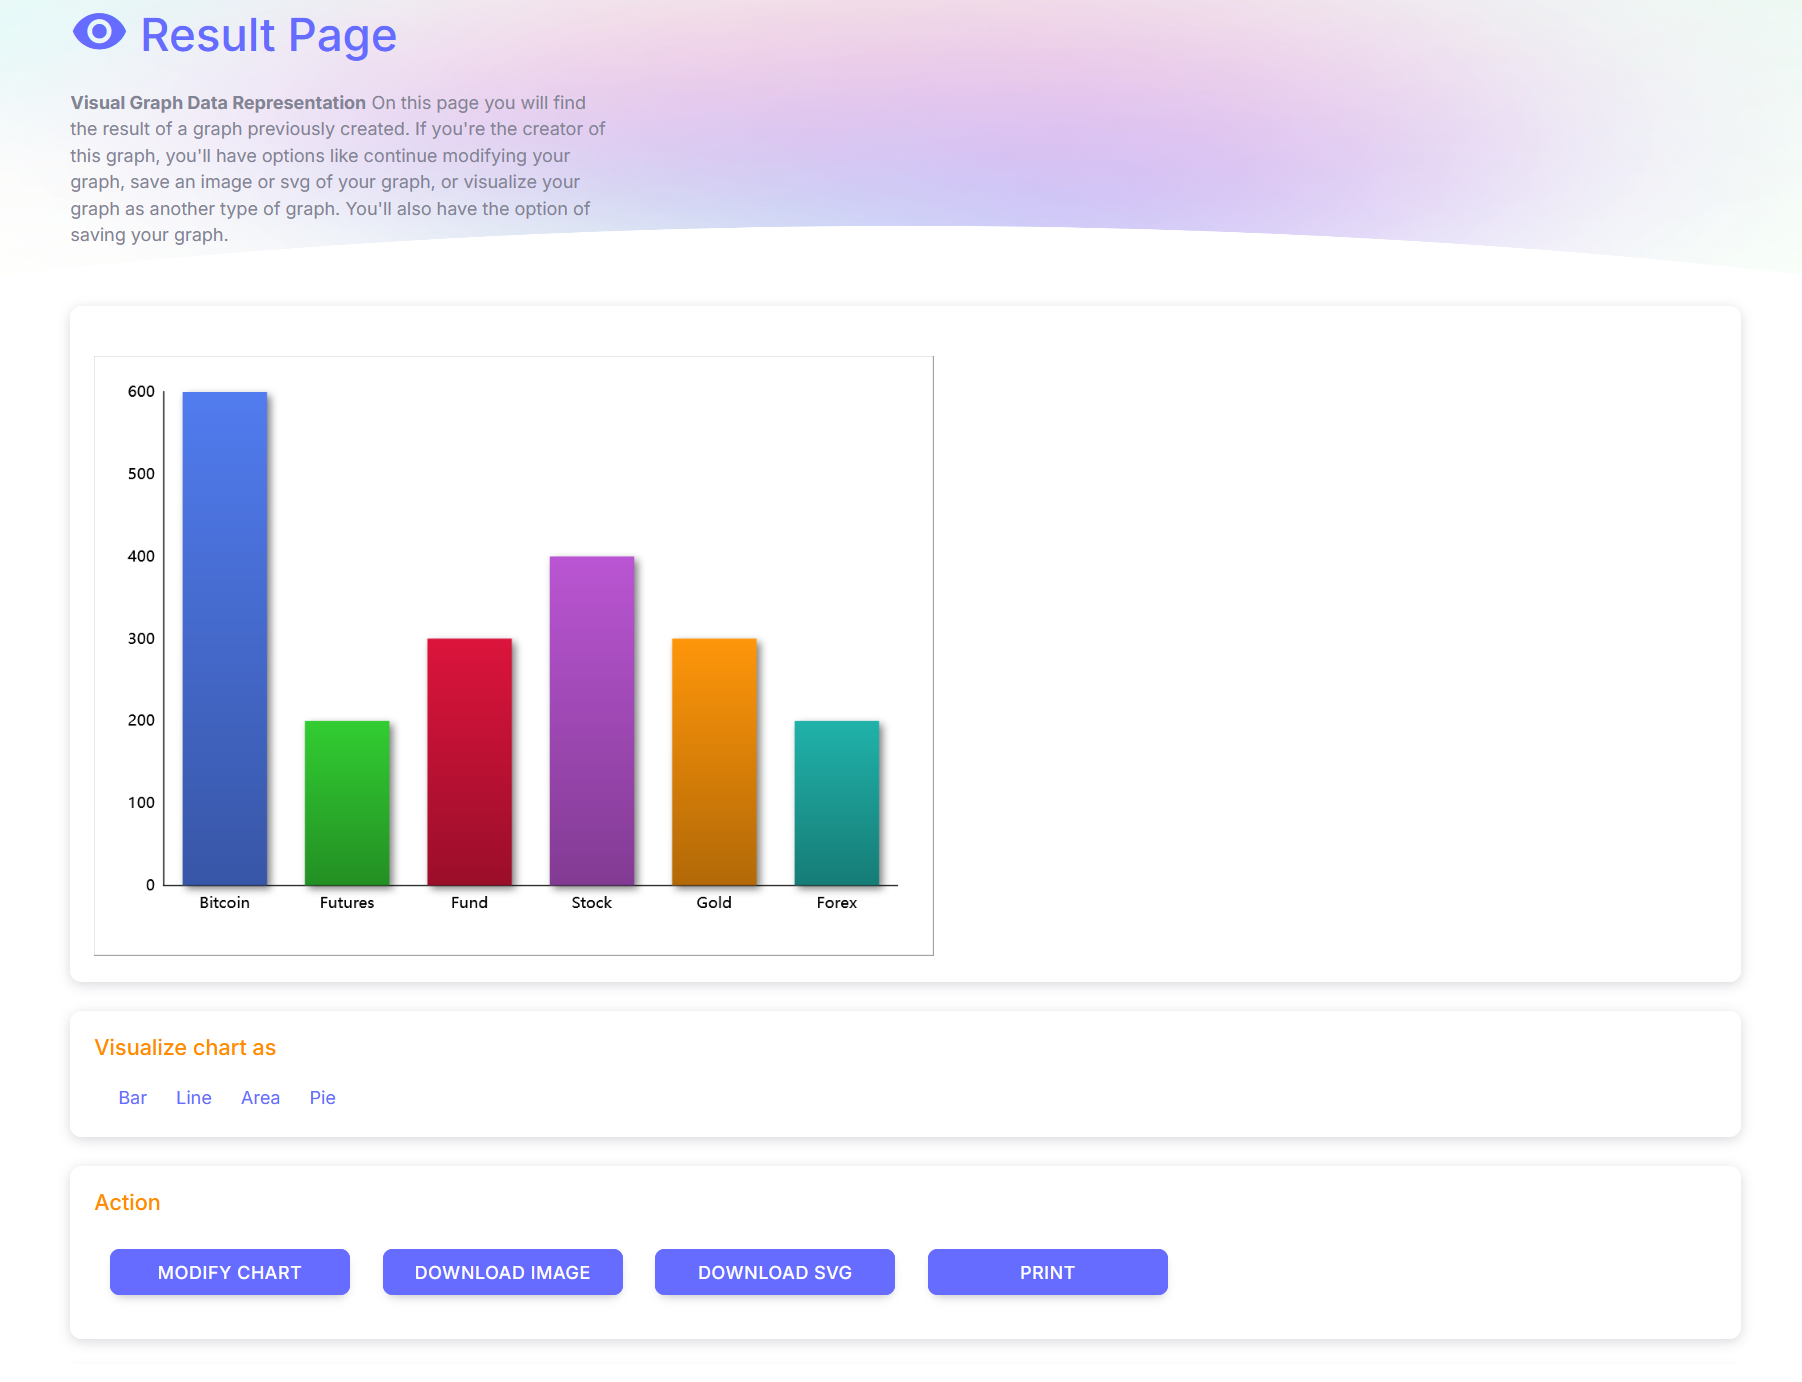
Result
The Result Page is where your generated chart image appears after click on "Create Chart" button. The result page more closely matches the
settings you entered compared to the preview. Under the generated Graph, you will find more options which we describe in detail below.
The Visualize Chart As section gives the ability to view your graph as different graph types. It provides a quick snapshot of what your data would
like like if you used another type of graph type.
In the Action section you will find the following options :
- MODIFY CHART Clicking on this will allow you to continue making modifications to your chart.
- DOWNLOAD IMAGE Click on this will download an image copy of your graph on your device.
- DOWNLOAD SVG Click on this will download an SVG copy of your graph on your device.
- PRINT Clicking on this will open a separate page with nothing more than your chart. This is useful if you wish to print your chart.
HOW TO SAVE OR SHARE A CHART
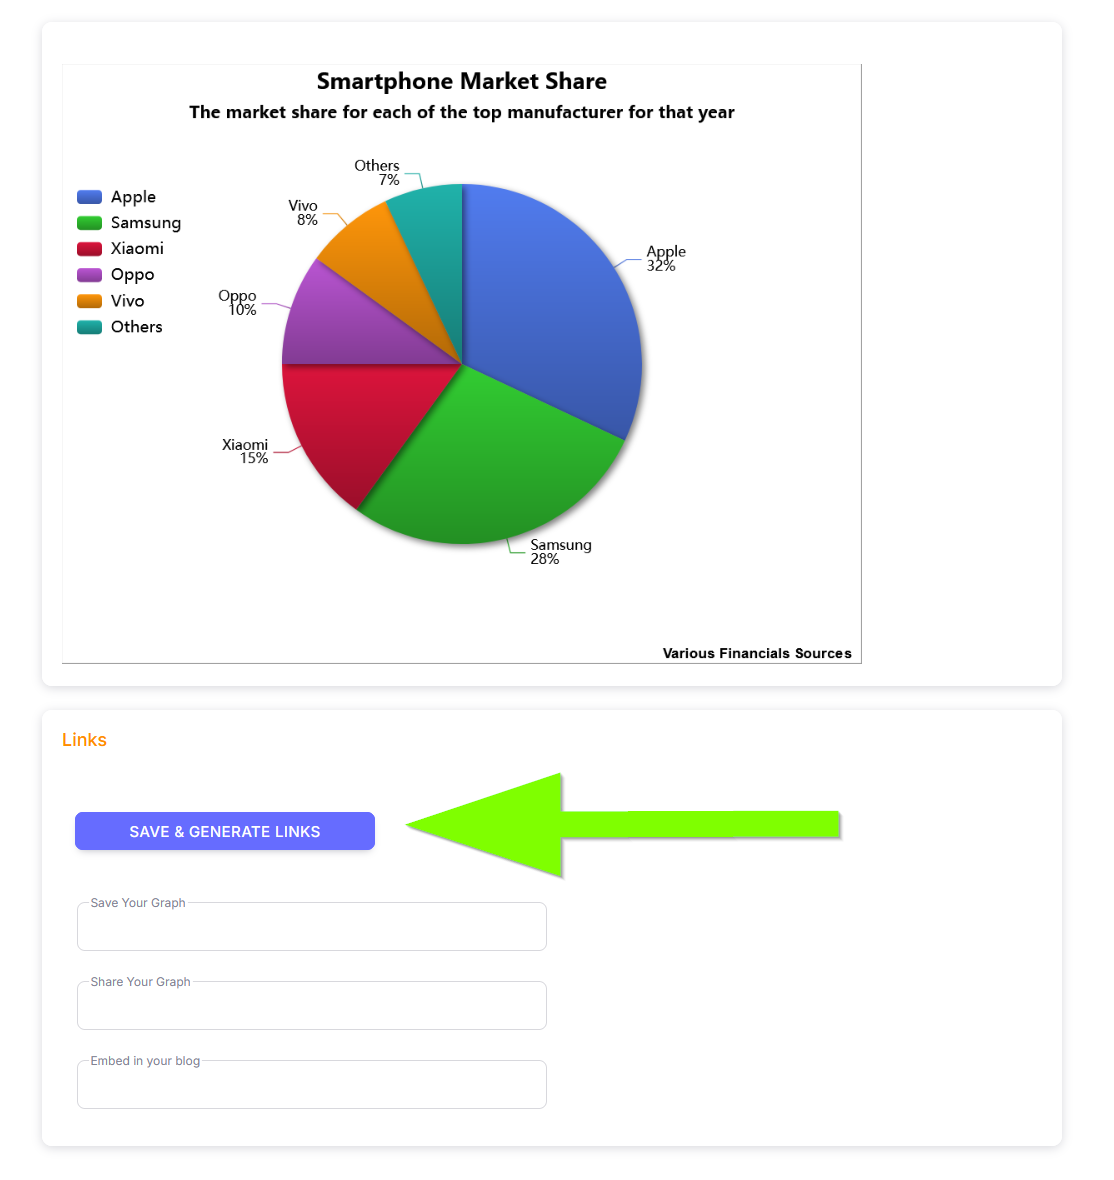
SAVE & GENERATE LINKS BUTTON
So you've completed your chart and now you want to save or share your chart. If you've followed the create chart guide, it means you are currently in the result page. From the result page, the first thing you need to do is click on the Save & Generate Links button. Clicking on this button populates the Save, Share and Embed fields. In the next tab section, we describe the fields in more detail.
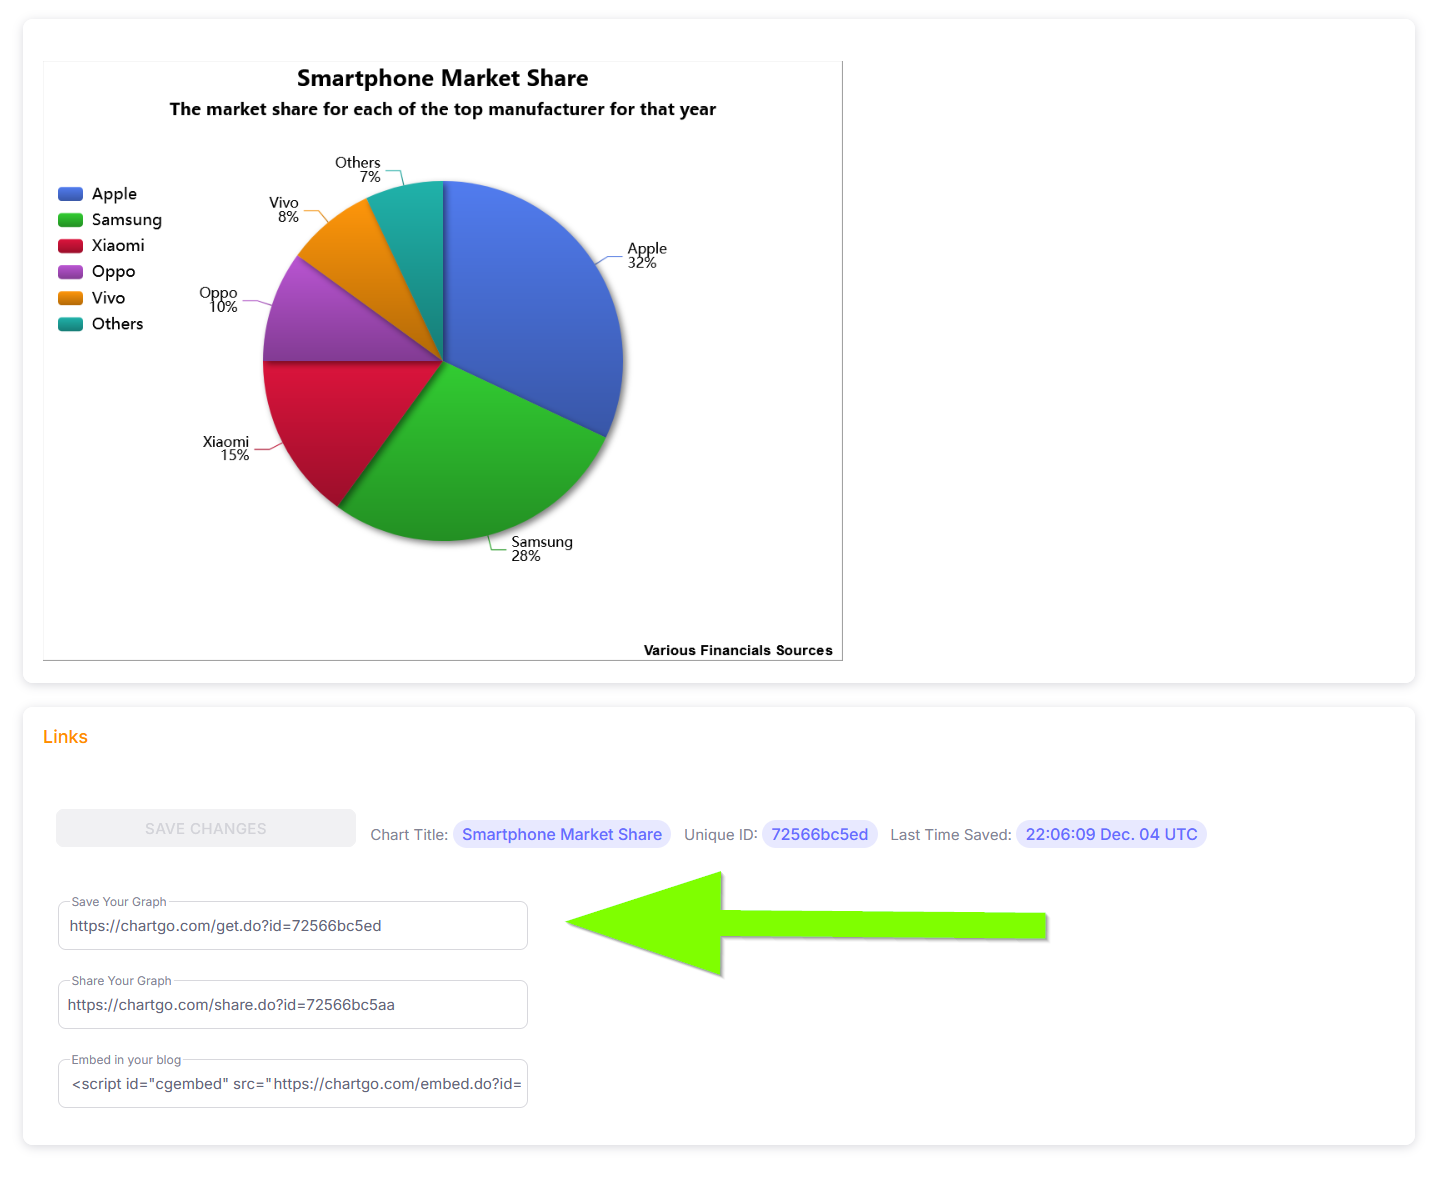
SAVE YOUR GRAPH LINK
The "Save Your Graph" feature allows you to revisit your chart at any time in the future.
Let’s say you’re satisfied with your chart now but want to make updates next week.
By using the saved link, ChartGo will reload your chart and bring you back to this exact page,
where you can seamlessly continue making modifications and applying additional changes.
To use this link, simply store it and use it when you're ready to come back to your chart.
Reminder that if you make this Save link available to others, they will have full access to your chart.
If you want to share your graph but not provide them with full permissions, only viewing permissions, continue to the next tab section "Share Your Graph Link".
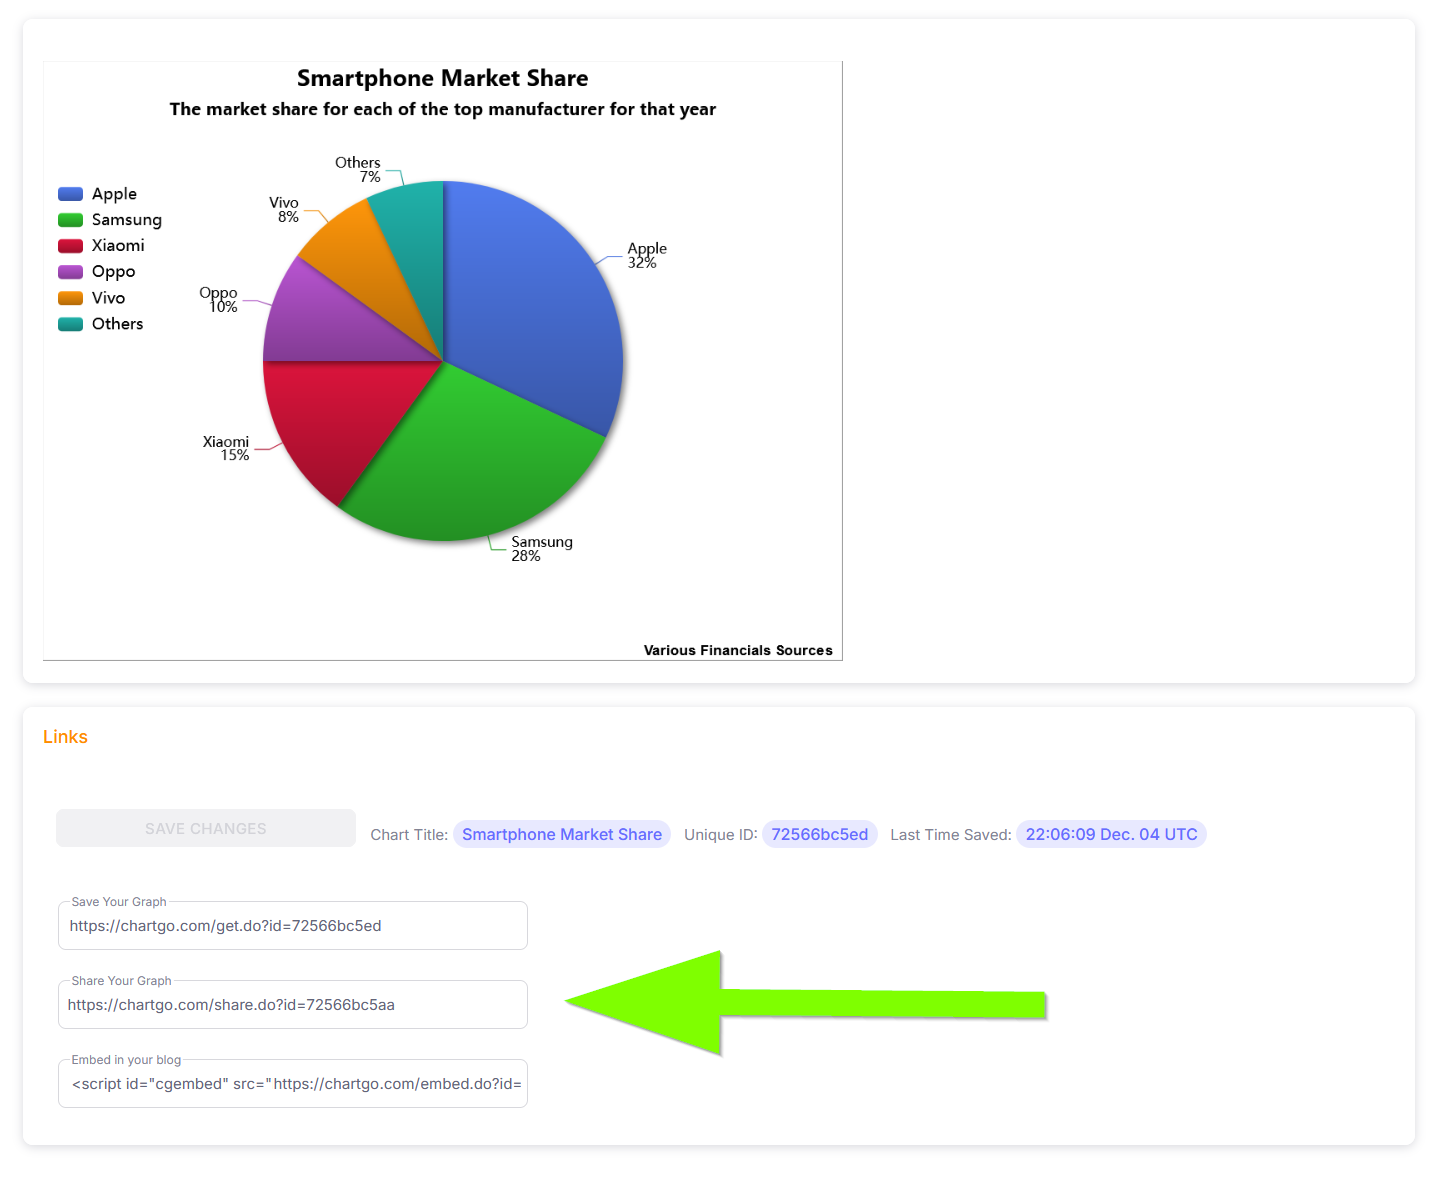
SHARE YOUR GRAPH LINK
The "Share Your Graph" link is designed for sharing your chart with others while ensuring it remains uneditable.
Once you've finalized your chart and want to share it with someone, this link provides them with a view-only version.
They will be directed to this page to see your chart, but they won't have the ability to make any changes.
They will not see your Save Your Graph link.
We recommend you use this link when sharing/showing your chart to others.

EMBED LINK
The embed link is only used for those that wish to show their chart image inside their webpage. This is useful for those that have their own website or blog. The chart will appear directly inside your page without having to go through ChartGo. If you plan on making additional changes to your chart, you simply need to make changes to your Chart by using the Save Your Graph link to retrieve it. Whatever changes you make, it will reflect in your embeded chart in your blog or webpage.