
Help & Troubleshooting - Resolve Common Issues
Before diving into this help section, we recommend checking out the ChartGo video tutorials or the ChartGo Guide first. If these resources don't solve your issue, explore the help topics below. If you still need assistance, feel free to contact us directly.
HELP WITH COMMON ISSUES
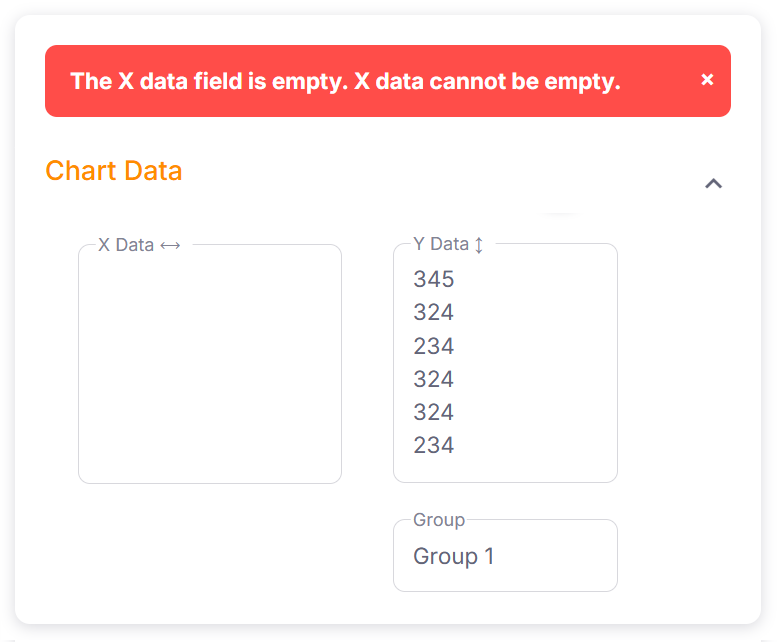
If you get this message it means that you left one or both of the data fields empty. The X and Y data fields both need data to create your graph.
If either one of them is empty, it does not have enough information to make a graph. So make sure you enter at least one line of of data in each Data field.

This message is informing you that your Y Data field has alphabetic characters in it. In the example above, the user entered "a b c d". These are not numeric values. Y Data can only accept numbers. ChartGo uses the numbers to measure the size of each bar column or pie slice.

You can get this message when using the address from the save link or share link. The message appears if the Unique ID that was provided do you
when you first saved your graph, is invalid.
Perhaps you typed it wrong or perhaps you saved it incorrectly or perhaps there are spaces in your id.
The first example above shows the error message and shows what an invalid key looks like. The second example displays what a typical valid key looks like.
The first example above shows the error message and shows what an invalid key looks like. The second example displays what a typical valid key looks like.

This message appears in the result page when there has been no activity for a long period of time and the user clicked on the "Generate or Save Your Links" link.
The system assumes the user is no longer active and has removed all information associated with the user's Chart.
There is still a possible way to regain your data. Under the error message, click on "Regenerate chart". ChartGo will try to restore all your previous data. If that didn't work, you'll need re-enter all your data :)
There is still a possible way to regain your data. Under the error message, click on "Regenerate chart". ChartGo will try to restore all your previous data. If that didn't work, you'll need re-enter all your data :)
Please make sure you're using the latest version of your browser. Or use another browser type to see if you're still having issues.
If you find you're still having an issues, you can always contact us.
We try to test with as many mobile devices as possible. But if you find the page is not appearing properly in your mobile device, try using a
laptop or computer. If you find you're still having an issues, you can always contact us.
If you would like to delete a previously chart, please send us a message via the contact us page.
Include your Save Link ID that you received when you clicked on Generate Link/Save Chart.
Need More Help?
You still have a question?
If you can't find the answer your looking for, please message us via the contact us page.